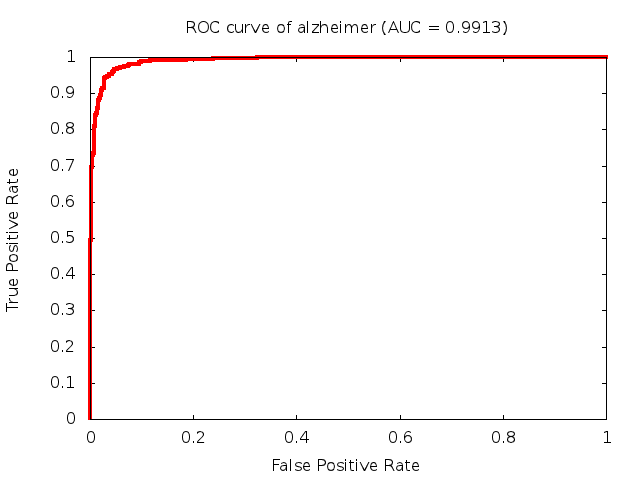
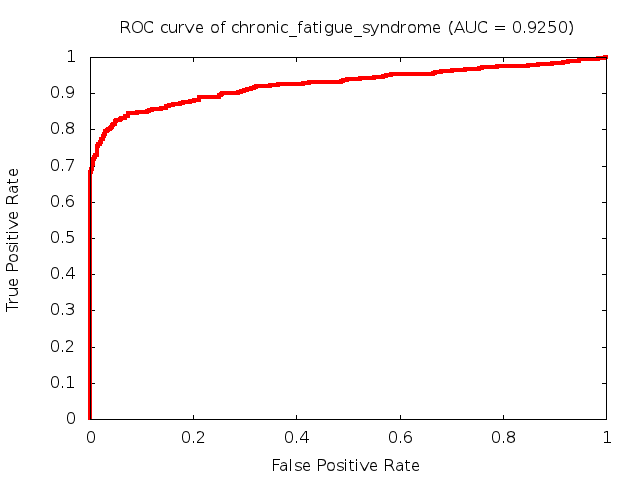
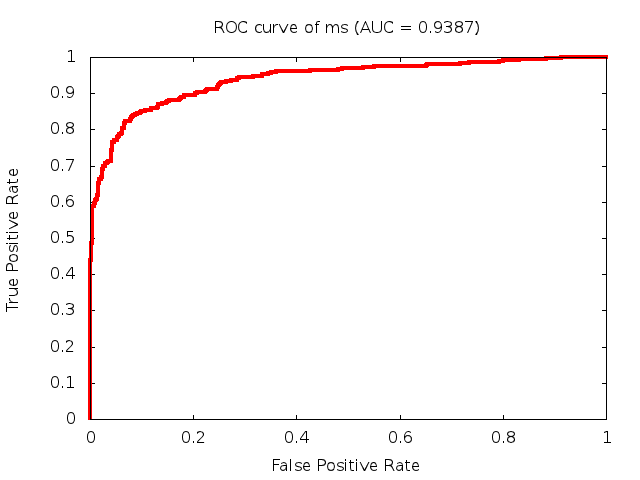
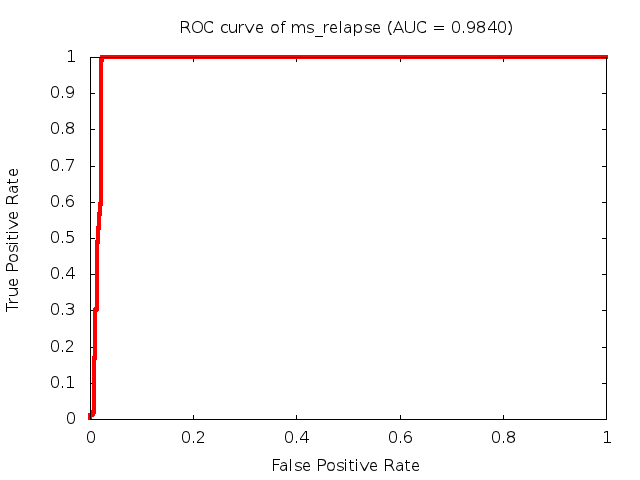
Predicted ROC curves for metabolomic marker profiles
In order to predict how accurate our device will be in classifying diseases we collected a corpus of metabolomic profiling literature. From it we extracted information about the distribution of metabolite concentrations for the control and patient groups in each study. Using this information we applied Monte Carlo techniques to build a synthetic data set representative of the study distribution, but including (considering) only the subset of markers available in our Tricorder. The method allowed us to combine metabolomic signatures from multiple studies into a single signature.
Metabolomic disease signatures that combine different levels and directions of change in multiple compounds create a system that is too complex to be directly understood and interpreted by humans. Machine learning techniques are therefore necessary for interpretation when combining multiple compounds into a single test. In order to classify the samples we used a support vector machine (SVM) with a Gaussian kernel. This algorithm is widely used in the field of metabolomics for interpreting metabolomic signatures.
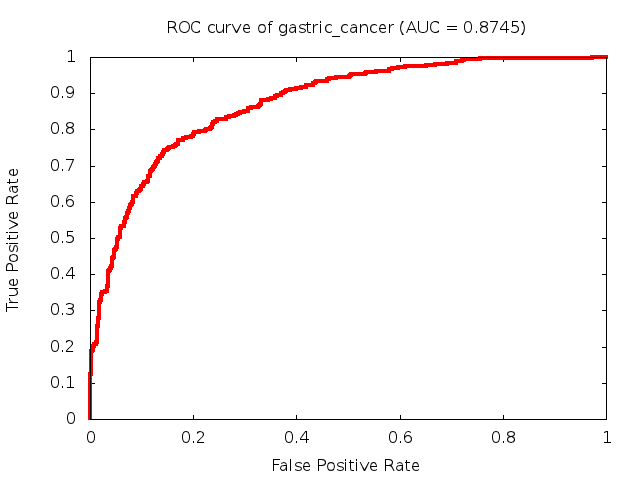
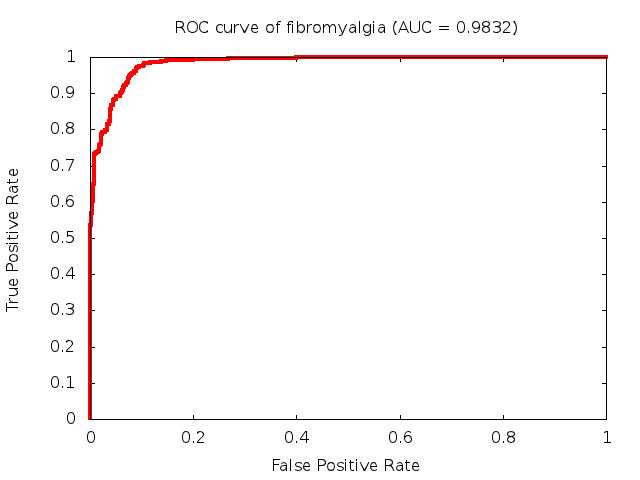
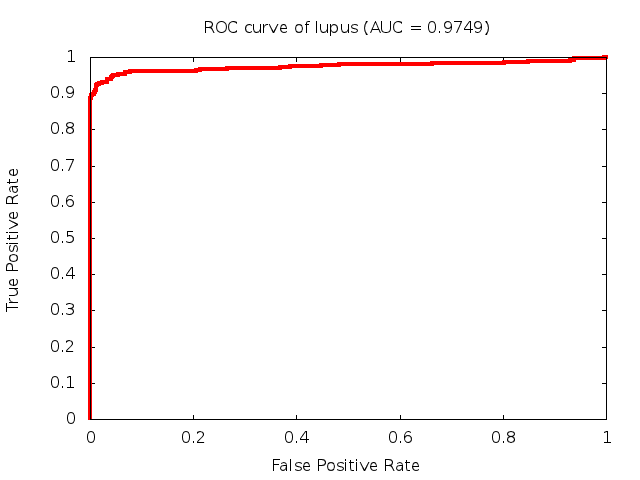
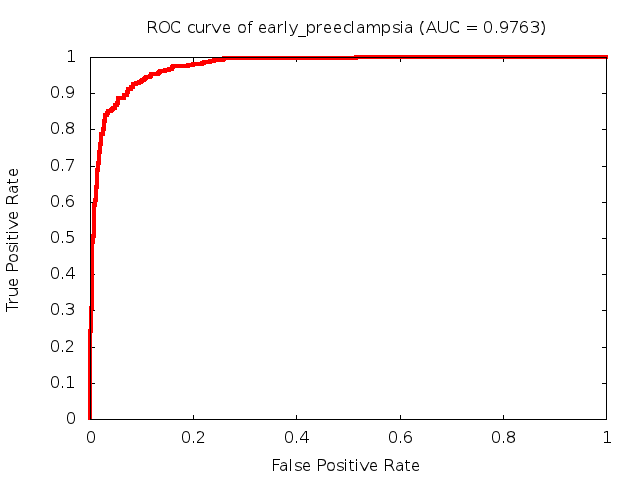
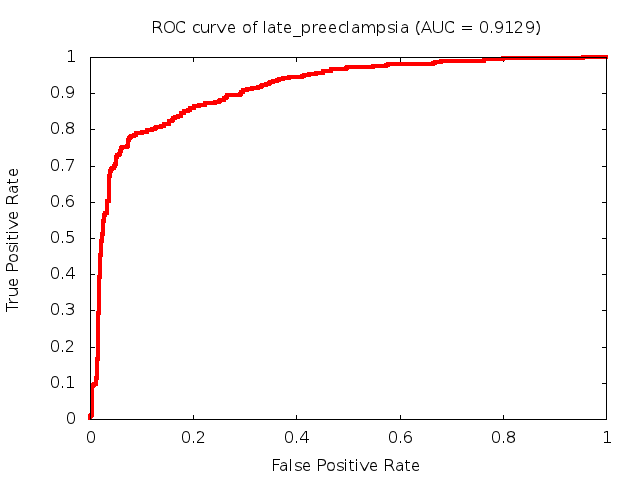
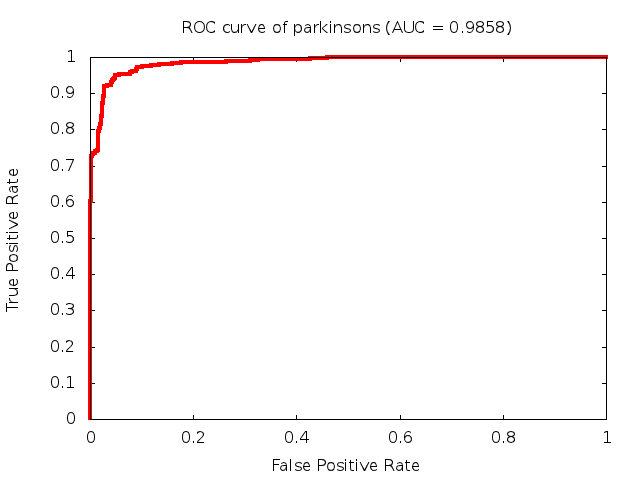
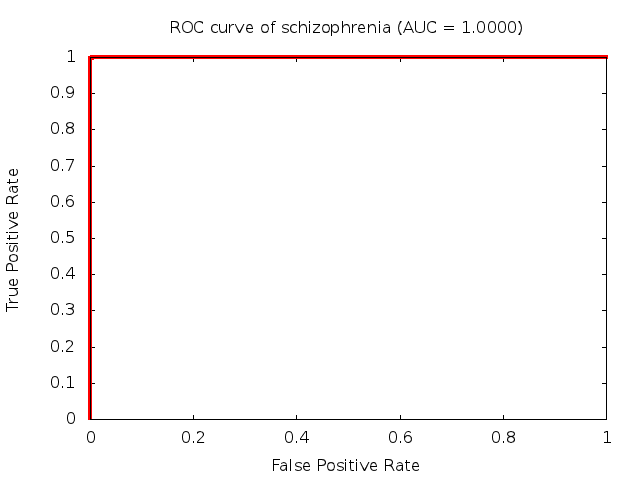
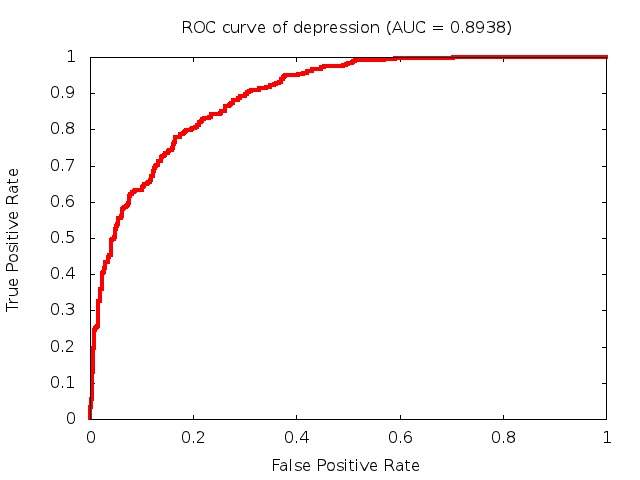
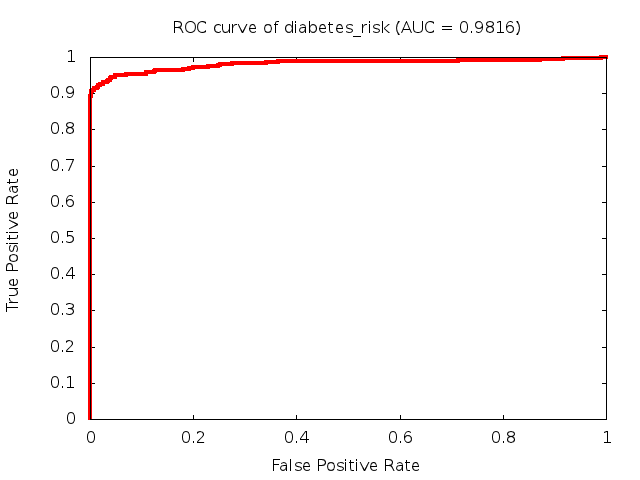
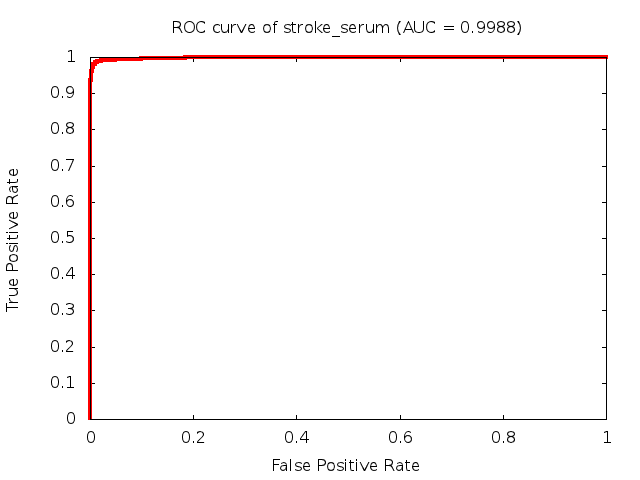
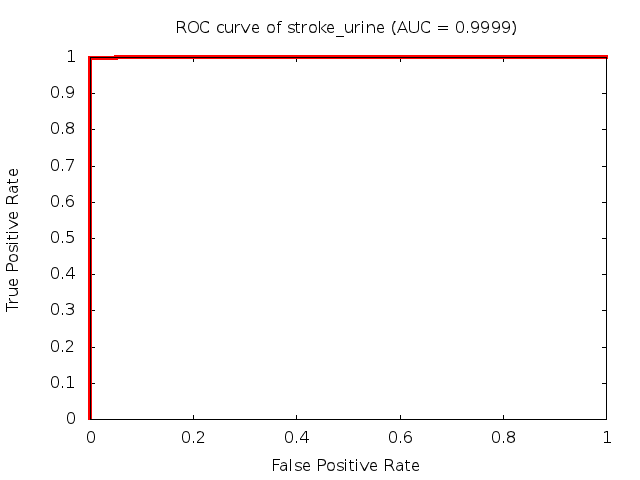
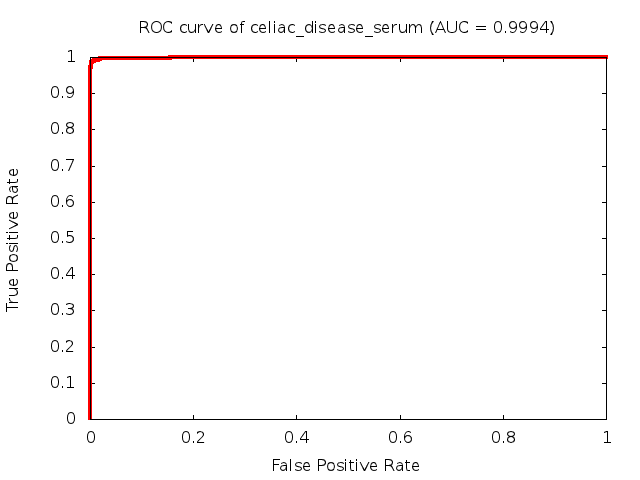
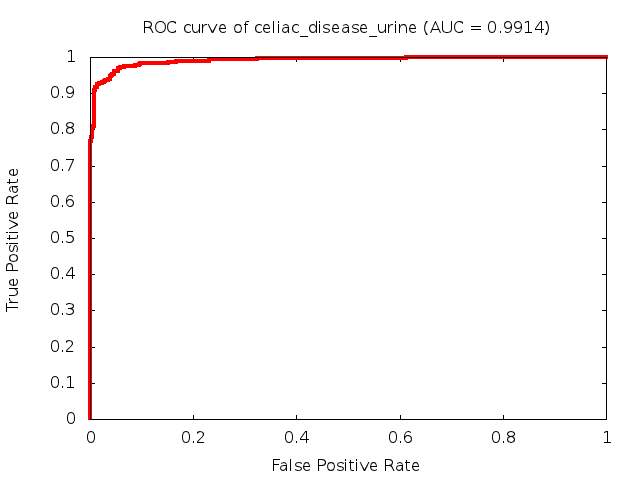
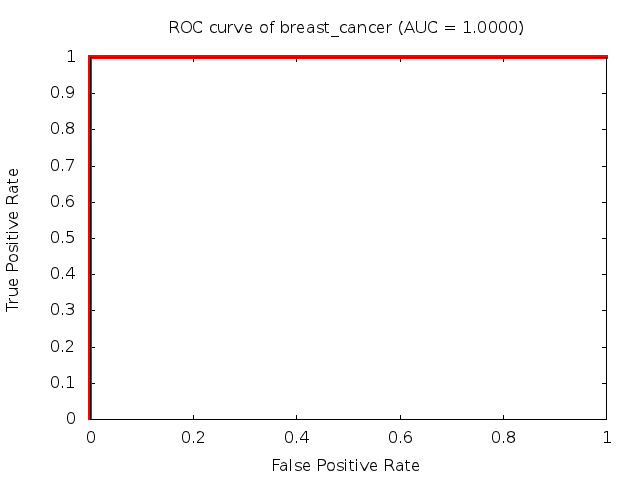
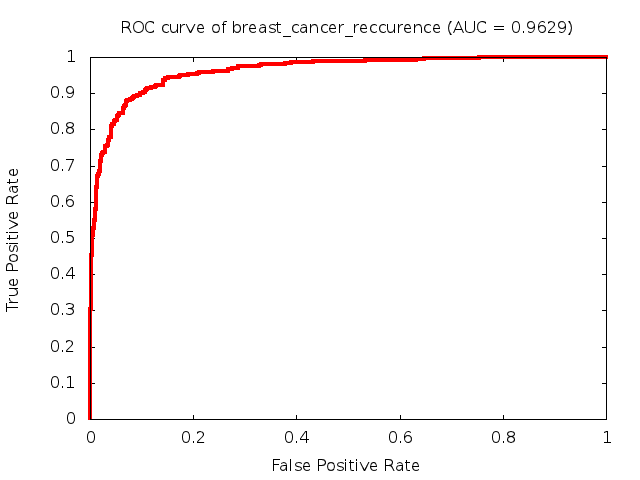
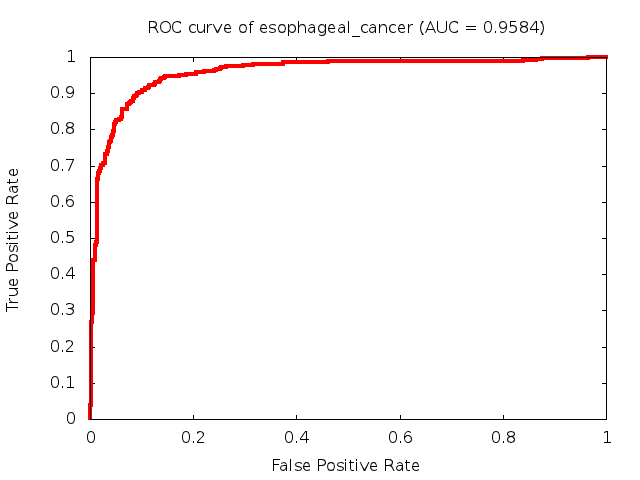
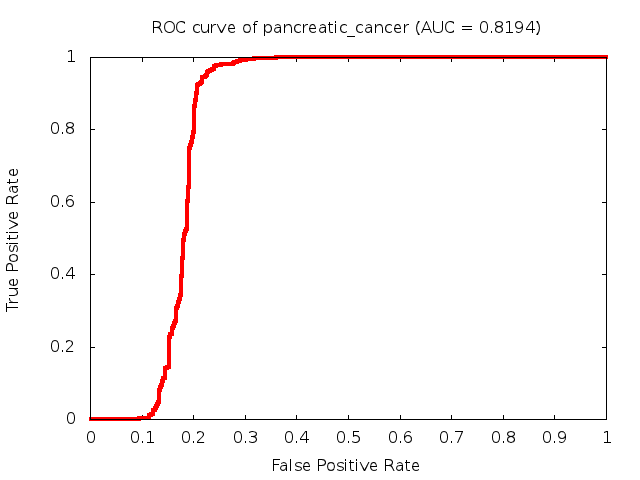
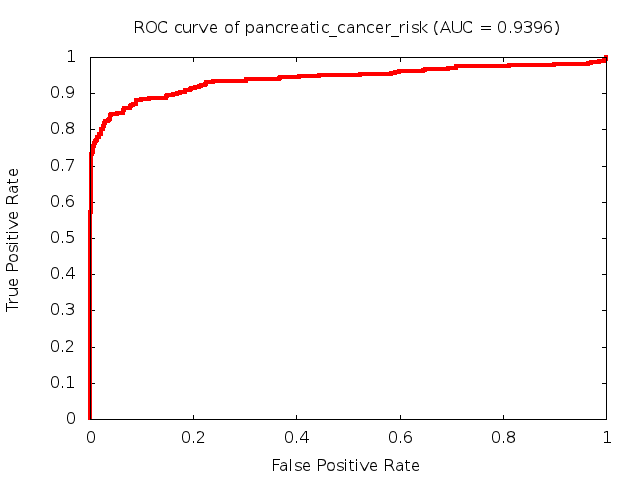
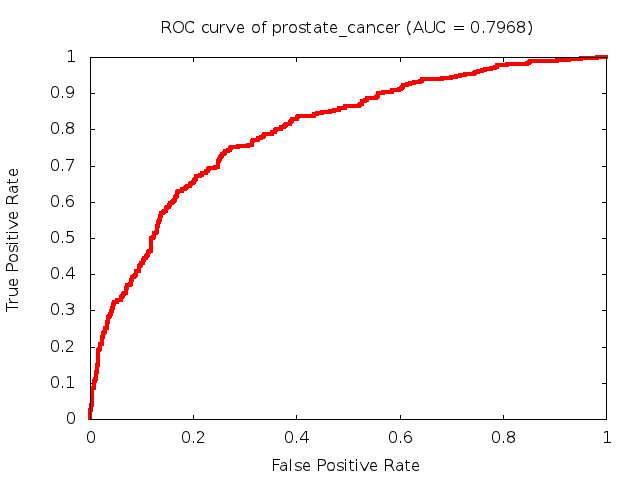
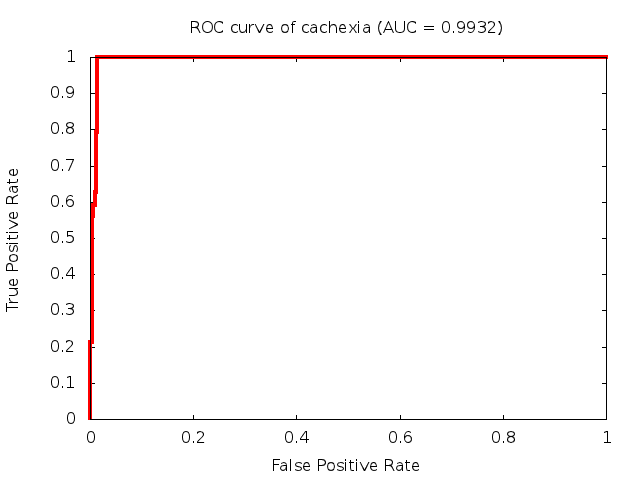
We used 5-fold cross-validation to evaluate the predictive ability of each model and created receiver operator characteristic curves (ROC curves) to summarize the results. ROC curves demonstrate how the rate of true positives vs. false positives. The area under the ROC curve (AUC) is a commonly used measure that summarizes the overall sensitivity and specificity as the separation parameters are varied. An AUC of 1.0 is a perfect score while 0.5 is equivalent to assigning labels randomly. An AUC of 0.85 is considered to be an acceptable value for most clinical applications.
Biomarkers of Preeclampsia
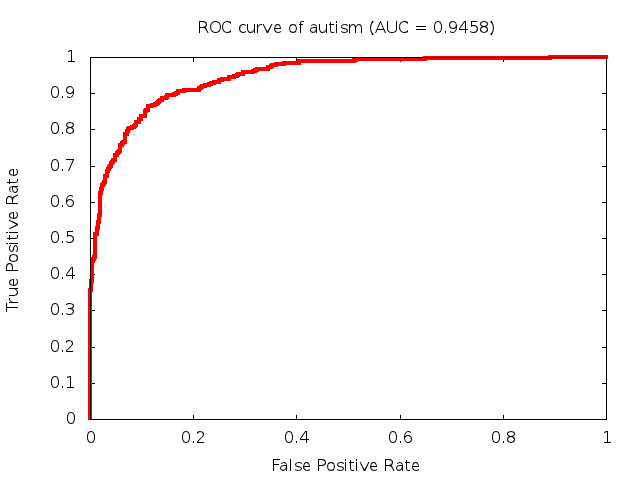
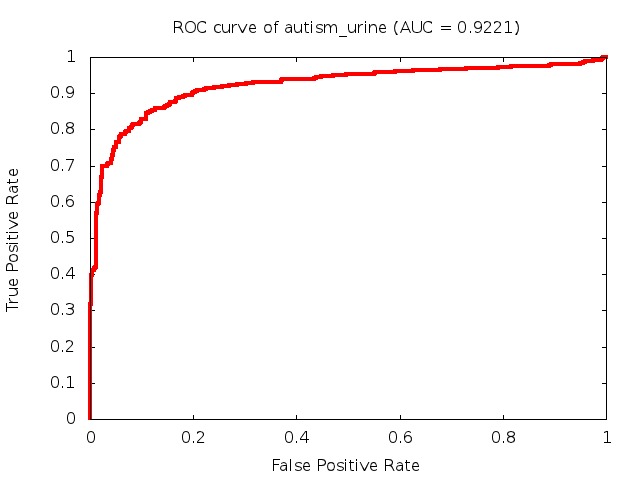
Biomarkers of Neurological Disorders
Diagnostic: Autism (blood test)
Biomarkers of Diabetes
Biomarkers of Cardiovascular Diseases
Biomarkers of Gastrointestinal and Renal disorders
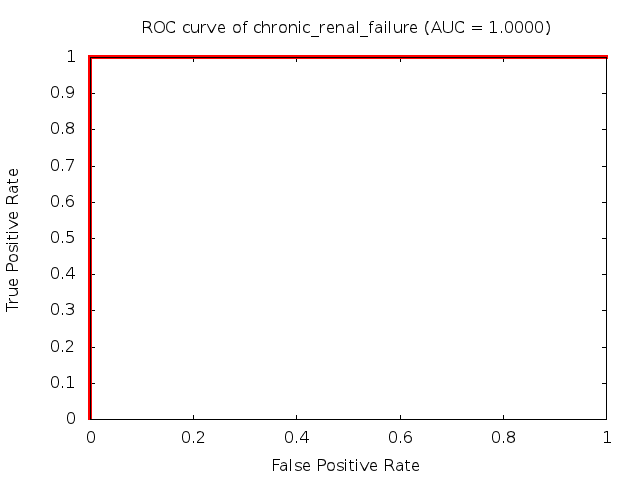
Biomarkers of Cancer
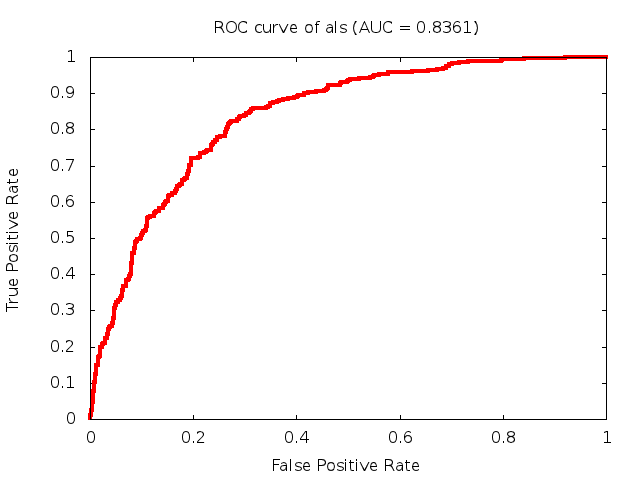
Predictive: Muscle Wasting Occurring as a Result of Cancer Cachexia (urine test)
- References:
- doi:10.1007/s11306-010-0232-9